Aditya Birla Sun Life International Equity Fund |
|
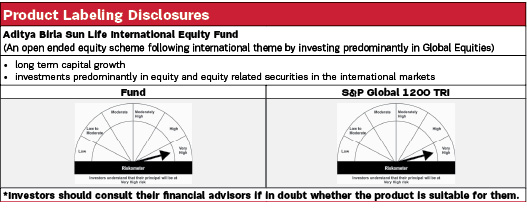
| An open ended equity scheme following international theme by investing predominantly in Global Equities. |

| *Fresh subscriptions/ switch-in application(s) including fresh registrations for subscriptions under systematic transactions are limited to Rs. 1 crore per investor per day at PAN level w.e.f February 14, 2024 Data as on 31st March 2024 |
 |
Fund Details |
|
 |
 |
Investment Objective |
|
| Aditya Birla Sun Life International Equity Fund seeks to generate long-term growth of capital, by investing predominantly in a diversified portfolio of equity and equity related securities in the international markets. | |
 |
| Fund Manager | |
|---|---|
| Mr. Dhaval Joshi |
| Managing Fund Since | |
|---|---|
| November 21, 2022 |
| Experience in Managing the Fund | |
|---|---|
| 1.4 Years |
| Load Structure (as % of NAV) (Incl. for SIP) | |
|---|---|
| Entry Load | Nil |
| Exit Load | For redemption/switch-out of units on or before 30 days from the date of allotment: 1% of applicable NAV. For redemption /switch-out of units after 30 days from the date of allotment: Nil. |
| Total Expense Ratio (TER) | |
|---|---|
| Regular | 2.53% |
| Direct | 1.95% |
| Including additional expenses and goods and service tax on management fees. | |
| AUM ₹ | |
|---|---|
| Monthly Average AUM | 200.53 Crores |
| AUM as on last day | 202.18 Crores |
| Date of Allotment | |
|---|---|
| October 31, 2007 |
| Benchmark | |
|---|---|
| S&P Global 1200 TRI |
| Other Parameters | |
|---|---|
| Portfolio Turnover | 0.71 |
| Application Amount for fresh subscription | |
|---|---|
| ₹ 1,000 (plus in multiplies of ₹ 1) |
| Min. Addl. Investment | |
|---|---|
| ₹ 1,000 (plus in multiplies of ₹ 1) |
| SIP | |
|---|---|
| Monthly: Minimum ₹ 1,000/- |
|
|
||
|---|---|---|
| Regular Plan | Direct Plan | |
| Growth | 33.4848 | 35.8573 |
| IDCW$: | 17.5430 | 35.8785 |
| $Income Distribution cum capital withdrawal | ||
|
PORTFOLIO |
|
| Issuer | % to Net Assets |
| United States of America | 57.38% |
| Ambev SA | 2.71% |
| MarketAxess Holdings Inc | 2.17% |
| The Bank of New York Mellon Corporation | 2.14% |
| Wells Fargo & Co | 2.13% |
| Zimmer Biomet Holdings Inc | 2.12% |
| Equifax Inc | 2.10% |
| Ecolab Inc | 2.09% |
| Teradyne Inc | 2.09% |
| NIKE Inc | 2.09% |
| Taiwan Semiconductor Manufacturing Co Ltd | 2.08% |
| Allegion PLC | 2.06% |
| GILEAD SCIENCES INC | 2.05% |
| CONSTELLATION BRANDS INC-A | 2.02% |
| Medtronic PLC | 2.01% |
| EMERSON ELECTRIC CO | 2.01% |
| Comcast Corp | 1.95% |
| Baidu Inc | 1.74% |
| Alibaba Group Holding Ltd | 1.73% |
| Masco Corp | 1.20% |
| Agilent Technologies Inc | 1.20% |
| The Walt Disney Company | 1.16% |
| ROPER TECHNOLOGIES INC | 1.16% |
| Alphabet Inc A | 1.12% |
| Raytheon Technologies Corp | 1.09% |
| TransUnion | 1.05% |
| State Street Corp | 1.05% |
| VEEVA SYSTEMS INC | 1.05% |
| Berkshire Hathaway Inc | 1.04% |
| Blackrock Inc | 1.03% |
| INTERCONTINENTAL EXCHANGE INC | 1.02% |
| Microchip Technology Inc | 0.96% |
| Rockwell Automation Inc | 0.96% |
| Polaris Inc | 0.91% |
| PHILIP MORRIS INTERNATIONAL INC | 0.91% |
| Tyler Technologies Inc | 0.88% |
| Fortinet Inc | 0.82% |
| Biogen Inc | 0.80% |
| Yum China Holdings Inc | 0.69% |
| United Kingdom | 9.22% |
| LONDON STOCK EXCHANGE GROUP | 2.22% |
| Issuer | % to Net Assets |
| EXPERIAN PLC | 2.09% |
| GSK PLC | 2.02% |
| Imperial Brands | 1.93% |
| UNILEVER PLC | 0.97% |
| France | 6.33% |
| Airbus SE | 2.28% |
| SAFRAN SA | 2.15% |
| Sanofi | 1.90% |
| Sweden | 4.35% |
| Elekta AB | 2.18% |
| Assa Abloy AB | 2.17% |
| Japan | 3.92% |
| Daifuku Co Ltd | 1.92% |
| HARMONIC DRIVE SYSTEMS INC NPV | 1.00% |
| Kao Corporation | 1.00% |
| FRANCE | 3.26% |
| ASMLHOLDING NV | 2.38% |
| Edenred SE | 0.88% |
| Belgium | 3.04% |
| Anheuser-Busch InBev SA/NV | 3.04% |
| Australia | 2.98% |
| Westpac Banking Corp | 1.98% |
| Australia & New Zealand Banking Group Limited | 0.99% |
| Switzerland | 2.01% |
| Julius Baer Group Limited | 1.07% |
| Cie Financiere Richemont SA | 0.94% |
| Singapore | 1.81% |
| Singapore Exchange Ltd | 1.81% |
| HongKong | 1.81% |
| Tencent Holdings | 1.81% |
| Germany | 1.70% |
| GEA GROUP AG | 1.06% |
| Bayer AG | 0.63% |
| Denmark | 1.07% |
| Novozymes A/S | 1.07% |
| Canada | 0.77% |
| BRP INC | 0.77% |
| Cash & Current Assets | 0.34% |
| Total Net Assets | 100.00% |
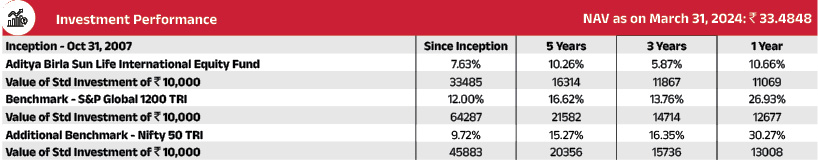
Past performance may or may not be sustained in future. The above performance is of Regular Plan - Growth Option. Kindly note that different plans have different expense structure. Load and Taxes are not considered for computation of returns. When scheme/additional benchmark returns are not available, they have not been shown. Total Schemes managed by Mr. Dhaval Joshi is 51. Click here to know more on performance of schemes managed by Fund Managers.
Note: The exit load (if any) rate levied at the time of redemption/switch-out of units will be the rate prevailing at the time of allotment of the corresponding units. Customers may request for a separate Exit Load Applicability Report by calling our toll free numbers 1800-270-7000 or from any of our Investor Service Centers.
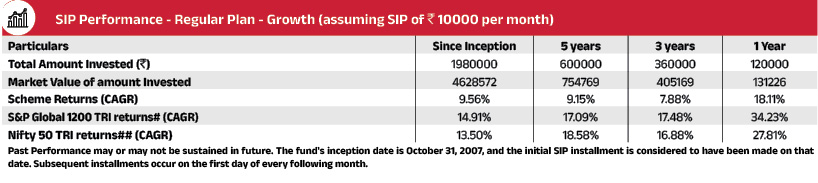
# Scheme Benchmark, ## Additional Benchmark
For SIP calculations above, the data assumes the investment of ₹ 10000/- on 1st day of every month or the subsequent working
day. Load & Taxes are not considered for computation of returns. Performance for IDCW option would assume reinvestment
of tax free IDCW declared at the then prevailing NAV. CAGR returns are computed after accounting for the cash flow by using
XIRR method (investment internal rate of return).Where Benchmark returns are not available, they have not been shown.
Past
performance may or may not be sustained in future. Returns greater than 1 year period are compounded annualized. IDCW
are assumed to be reinvested and bonus is adjusted. Load is not taken into consideration.